

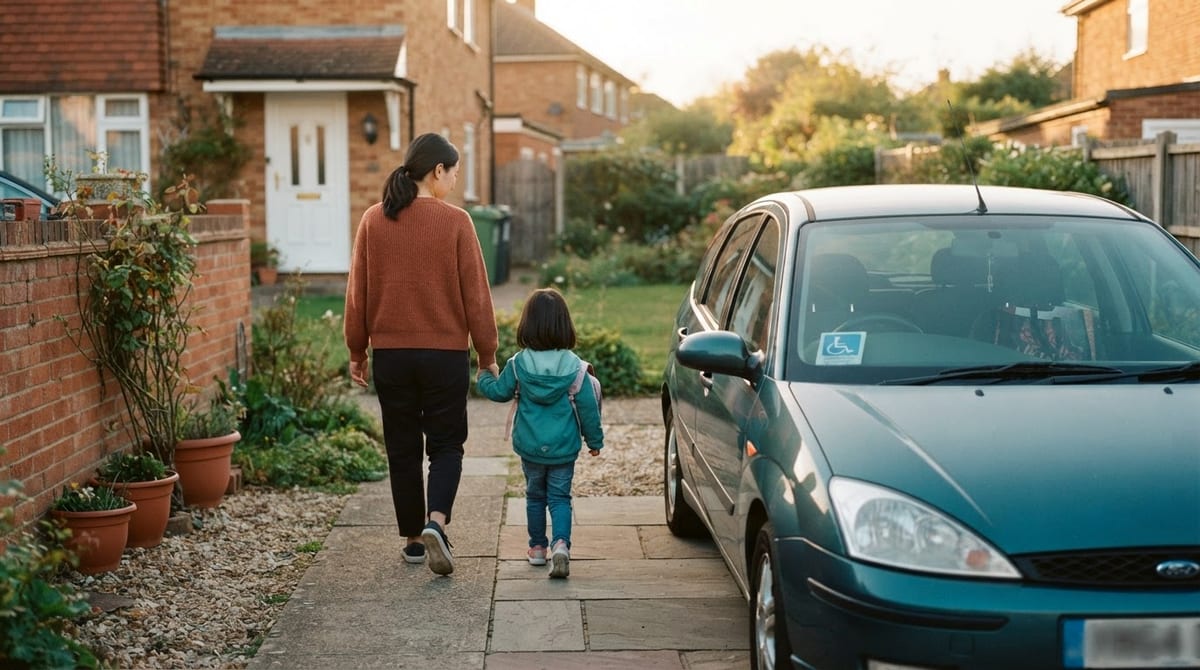
Your son bolts. Not sometimes, every time he’s near a road, and no amount of hand-holding changes that. He doesn’t have a wheelchair or a walking stick.
To anyone watching from a car window, there’s nothing wrong with him at all. But getting him from the car to the school gate, or across a supermarket car park, is the most dangerous ten seconds of your day.
Since August 2019, a child like this can qualify for a Blue Badge without ever meeting the old physical-disability tests. Our guide to Blue Badges for children walks parents and carers through how to apply, step by step.
We built every figure below from the Department for Transport’s own published tables. They show real, fast growth in this route nationally, and a genuinely wide spread between councils in how much they use it. What they can’t show is a refusal rate, for your council or any other, because the government simply doesn’t publish one.
Why the hidden disability route exists
Before August 2019, the Blue Badge scheme mostly measured what a body could do: could you walk, and how far. That left out people whose disability affects mobility in a different way.
Someone with autism who bolts towards traffic. Someone whose anxiety makes an ordinary car park feel like a threat.
The Disabled Persons (Badges for Motor Vehicles) (England) (Amendment) Regulations 2019 changed that. Since 30 August 2019, an expert assessor can certify that a disability causes “very considerable difficulty whilst walking” during a journey. That difficulty, the regulation says, may include “very considerable psychological distress.”
The same rule covers someone who would be at risk of serious harm during a journey, or who would pose that risk to someone else. The government called it, at the time, the biggest change to the scheme in nearly 50 years.
In practice, councils apply this to a range of conditions, autism and mental health conditions among them.
Automatic entitlement (DLA higher rate mobility, qualifying PIP scores, and similar) needs no assessment. The discretionary route, which includes hidden disabilities, always needs a council assessment. Our Blue Badge guide covers both routes and exactly what to send in.
How fast the hidden disability route has grown
The scheme’s data tables track exactly how many badges get issued each year under the hidden disability criteria specifically, separately from every other reason someone might qualify. That gives a clean national trend, even though it doesn’t extend down to council level.
Source: Department for Transport, Blue Badge scheme statistics: April 2024 to March 2025, Table DIS0111
The route’s first year, from 30 August 2019 to 31 March 2020, isn’t shown above. It covers only seven months, not a full year, and its 23,000 badges aren’t directly comparable to the annual figures either side.
From the first full year on, though, the trend is unbroken: 18,000 in 2020/21, climbing to 55,000 by 2024/25. That’s more than triple in four years. Hidden disability badges now make up 4.3% of every Blue Badge issued in England, and 7.5% of all badges issued through any discretionary route.
The postcode lottery you can’t check
We looked for a table showing, council by council, how many hidden disability applications were received, how many were granted, and how many were refused. It doesn’t exist.
We checked every table DfT publishes on the Blue Badge scheme, plus the release’s own commentary and its quality report, line by line. None of them mention applications received or refused, anywhere, for any council, for any eligibility route.
The scheme’s statistics only count badges that were successfully issued or are currently held. A true refusal-rate ranking, the kind that would let you check your own council against the next one over, can’t be built from anything the government publishes.
What DfT’s local authority tables do show is how many discretionary Blue Badges get issued each year, per head of population. That figure bundles hidden disability applicants together with everyone else who needs a council assessment, since DfT doesn’t split this further by council.
It’s not a refusal rate. It’s the closest thing to a “how generously is this being used near you” signal that the published data supports, and the gap between councils is large.
Source: Our calculation from Department for Transport, Blue Badge scheme statistics: April 2024 to March 2025, Tables DIS0105 and DIS0108
We only ranked councils that issue at least 500 discretionary badges a year, enough to compare fairly. That excluded one council whose own figures DfT flags as incomplete for this measure.
Among the 150 that clear the bar, the rate ranges from 211 per 100,000 people in Tower Hamlets to 2,359 in Dorset, an 11-fold difference. England’s average is 1,245 per 100,000.
Even comparing the middle of the range rather than the extremes, the gap holds up. A council at the 90th percentile issues nearly three times as many discretionary badges per head as one at the 10th.
Don’t read this chart as a league table of harsh and lenient councils. Every low-scoring area on it is an inner London borough; every high-scoring one is a larger, more rural or car-dependent county. Some of that gap is almost certainly demand, not decisions: older populations, fewer people who can rely on buses and trains, and different rates of eligible conditions. Without published application and refusal figures, nobody, including us, can say how much of the remaining gap is genuine local practice.
If your own application is refused, you have no official benchmark to point to and say your council is unusually strict. What you do have is a right to ask why, and a process for challenging it.
How to evidence a hidden disability application
The eligibility test asks a specific question. Does your child’s condition cause “very considerable difficulty” on a journey, including psychological distress, or put them or someone else at risk of serious harm?
Councils assess this with an expert assessor, not simply on your say-so. The application succeeds or fails on the quality of the evidence behind it.
Gov.uk’s own guidance on discretionary applications asks for detail on:
- Relevant medication your child takes for the condition
- Relevant treatments they receive or are due to receive
- Healthcare or associated professionals who have been involved in their care
- Supporting documents, such as prescriptions, diagnosis letters, or correspondence between the professionals treating them
Write about a real, specific trip, not a general description of the diagnosis. “He ran into the road outside the school gate on Tuesday and I couldn’t catch him in time” says more than “he has autism and no road awareness.” A letter from a paediatrician, the school’s SENCO (Special Educational Needs Coordinator), or a specialist that backs up the same example carries real weight.
Discretionary applications can take 12 weeks or longer to assess, since they involve an assessor’s judgement rather than a benefits check. If your child has an Education, Health and Care Plan (EHCP), check its recent assessments for anything describing their needs around safety, awareness, or anxiety. That’s often strong evidence you already have sitting in a folder.
How to challenge a refusal
If the council refuses, it should tell you why. From there, you have the same options as any discretionary refusal:
- Ask for an internal review. Most councils offer one, though timescales vary.
- Send additional evidence and reapply, particularly if the refusal letter names a specific gap.
- Complain to the Local Government and Social Care Ombudsman if you think the council didn’t follow its own process properly.
Our Blue Badge guide sets out each of these steps in full, along with the automatic-entitlement route for children on DLA higher rate mobility.
Because no official figures are published on how often councils refuse hidden disability applications, comparing your council to a league table that doesn’t exist won’t get you far. What helps is evidence that describes a real, specific trip or outing, not just a diagnosis. Use the review and complaint routes above if the first answer is no.
Methodology and sources
The national hidden-disability trend comes from the Department for Transport’s Blue Badge scheme statistics: April 2024 to March 2025 (published 19 March 2026). It’s Table DIS0111, “Valid Blue Badges issued to disabled people by category: England.” That table reports the non-visible disability criteria as its own column, back to the first partial year in 2019/20. Our computed shares of all badges issued (2.2% in 2020/21, 4.3% in 2023/24 and 2024/25) match DfT’s own published percentages for those years, confirming the figures are read correctly.
The local-authority figures come from the same release’s Tables DIS0108 (badges issued and held, by council) and DIS0105 (council population). These tables report a combined “subject to further assessment” category, covering hidden disabilities alongside every other discretionary reason, such as a physical difficulty walking that doesn’t meet the automatic criteria. DfT doesn’t publish a hidden-disability-only breakdown below England level, which is why the local-authority chart above is described as “discretionary,” not “hidden disability” specifically. We ranked only councils issuing at least 500 discretionary badges in the year. That excluded one council, Bury, whose 2025 category breakdown DfT’s own footnotes flag as incomplete due to a local data issue. It also excluded two authorities, the City of London and the Isles of Scilly, whose population figures weren’t usable for a per-capita rate. 150 councils were ranked.
We searched every DIS table, the release’s bulletin commentary, and its background quality report for any mention of applications received or refused. None exists, at national or local-authority level, for any Blue Badge eligibility route. The scheme’s statistics measure badges successfully issued or held, not the applications behind them. The full extraction script and every source table are kept in our internal research records for this report. Data accessed 30 July 2026.